My Weight Chart
Your progress, visualized.
Turn your raw weight data into aesthetic, gallery-worthy charts.
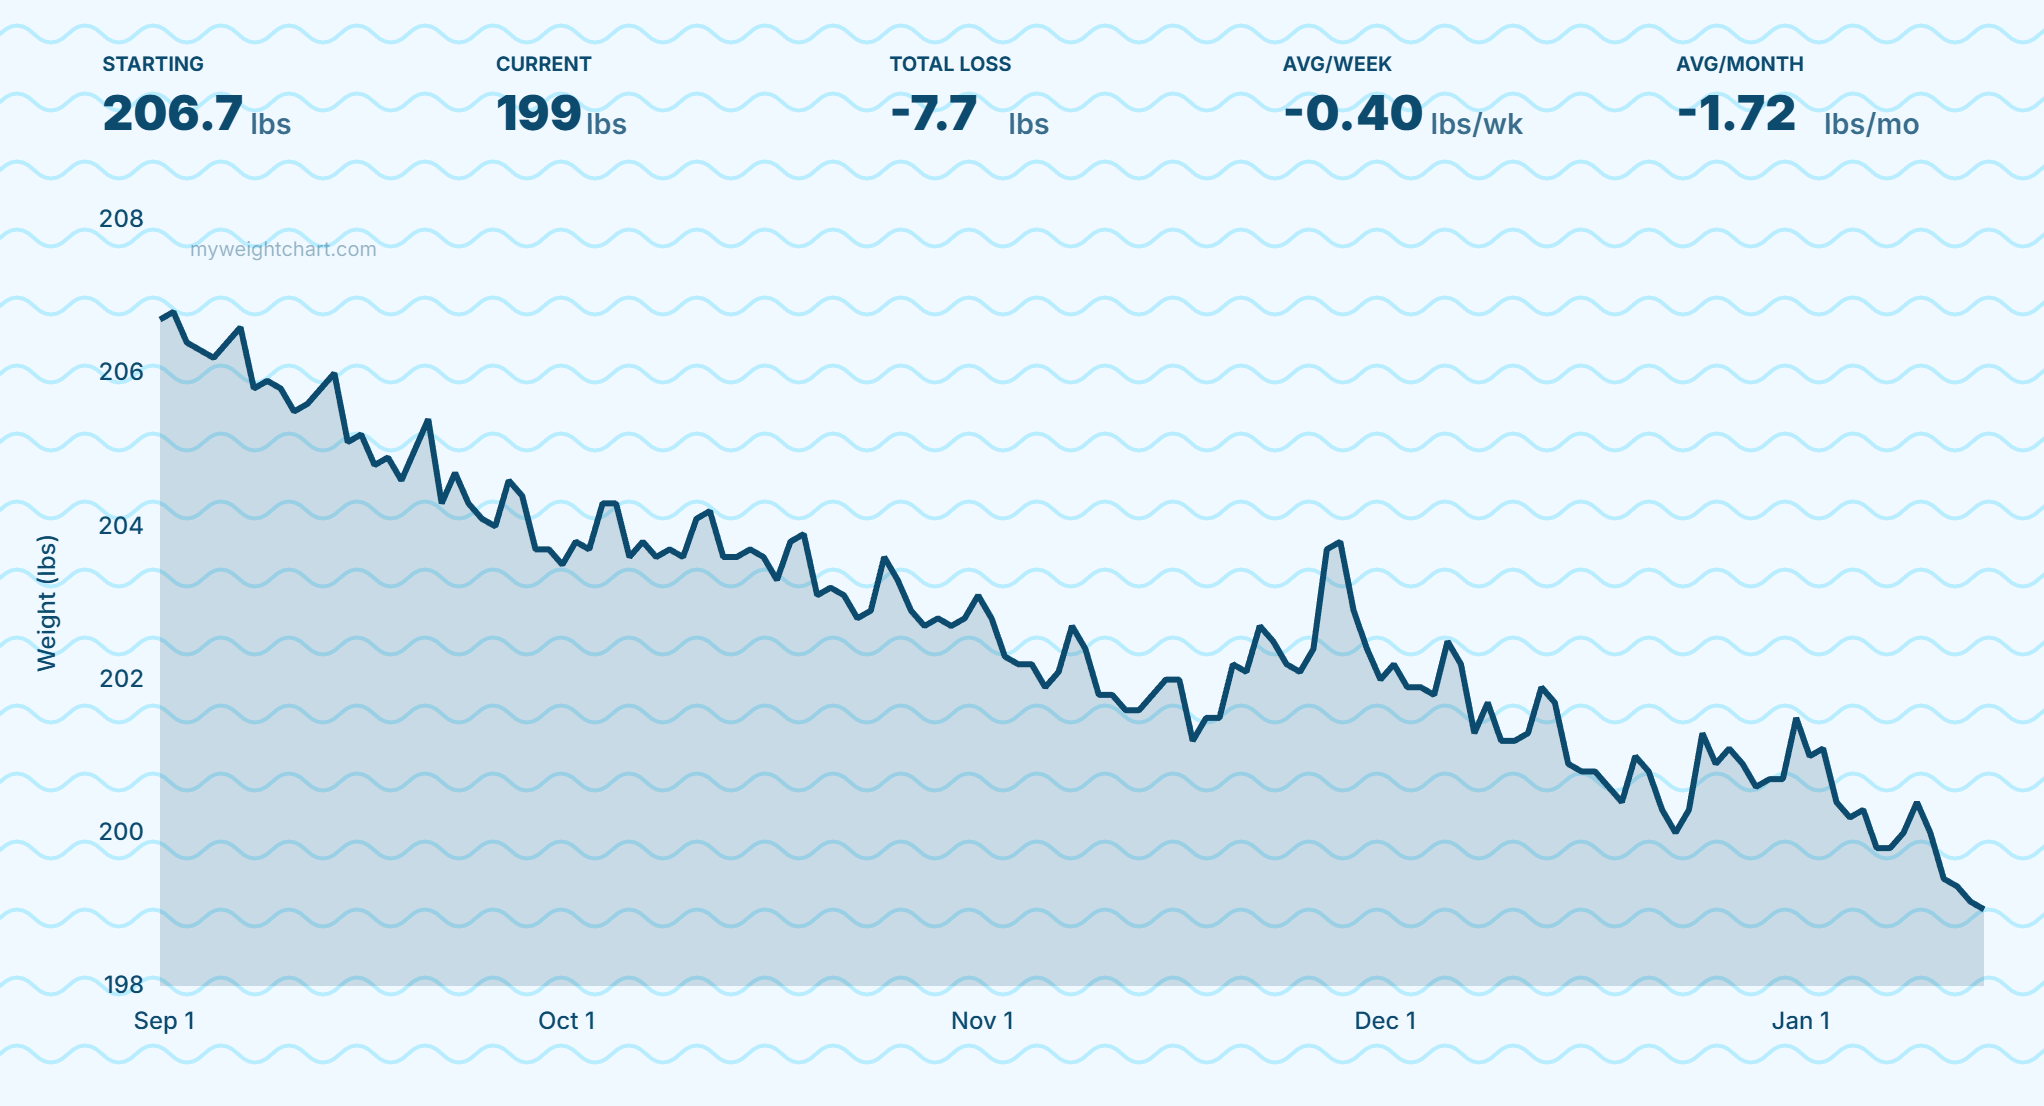
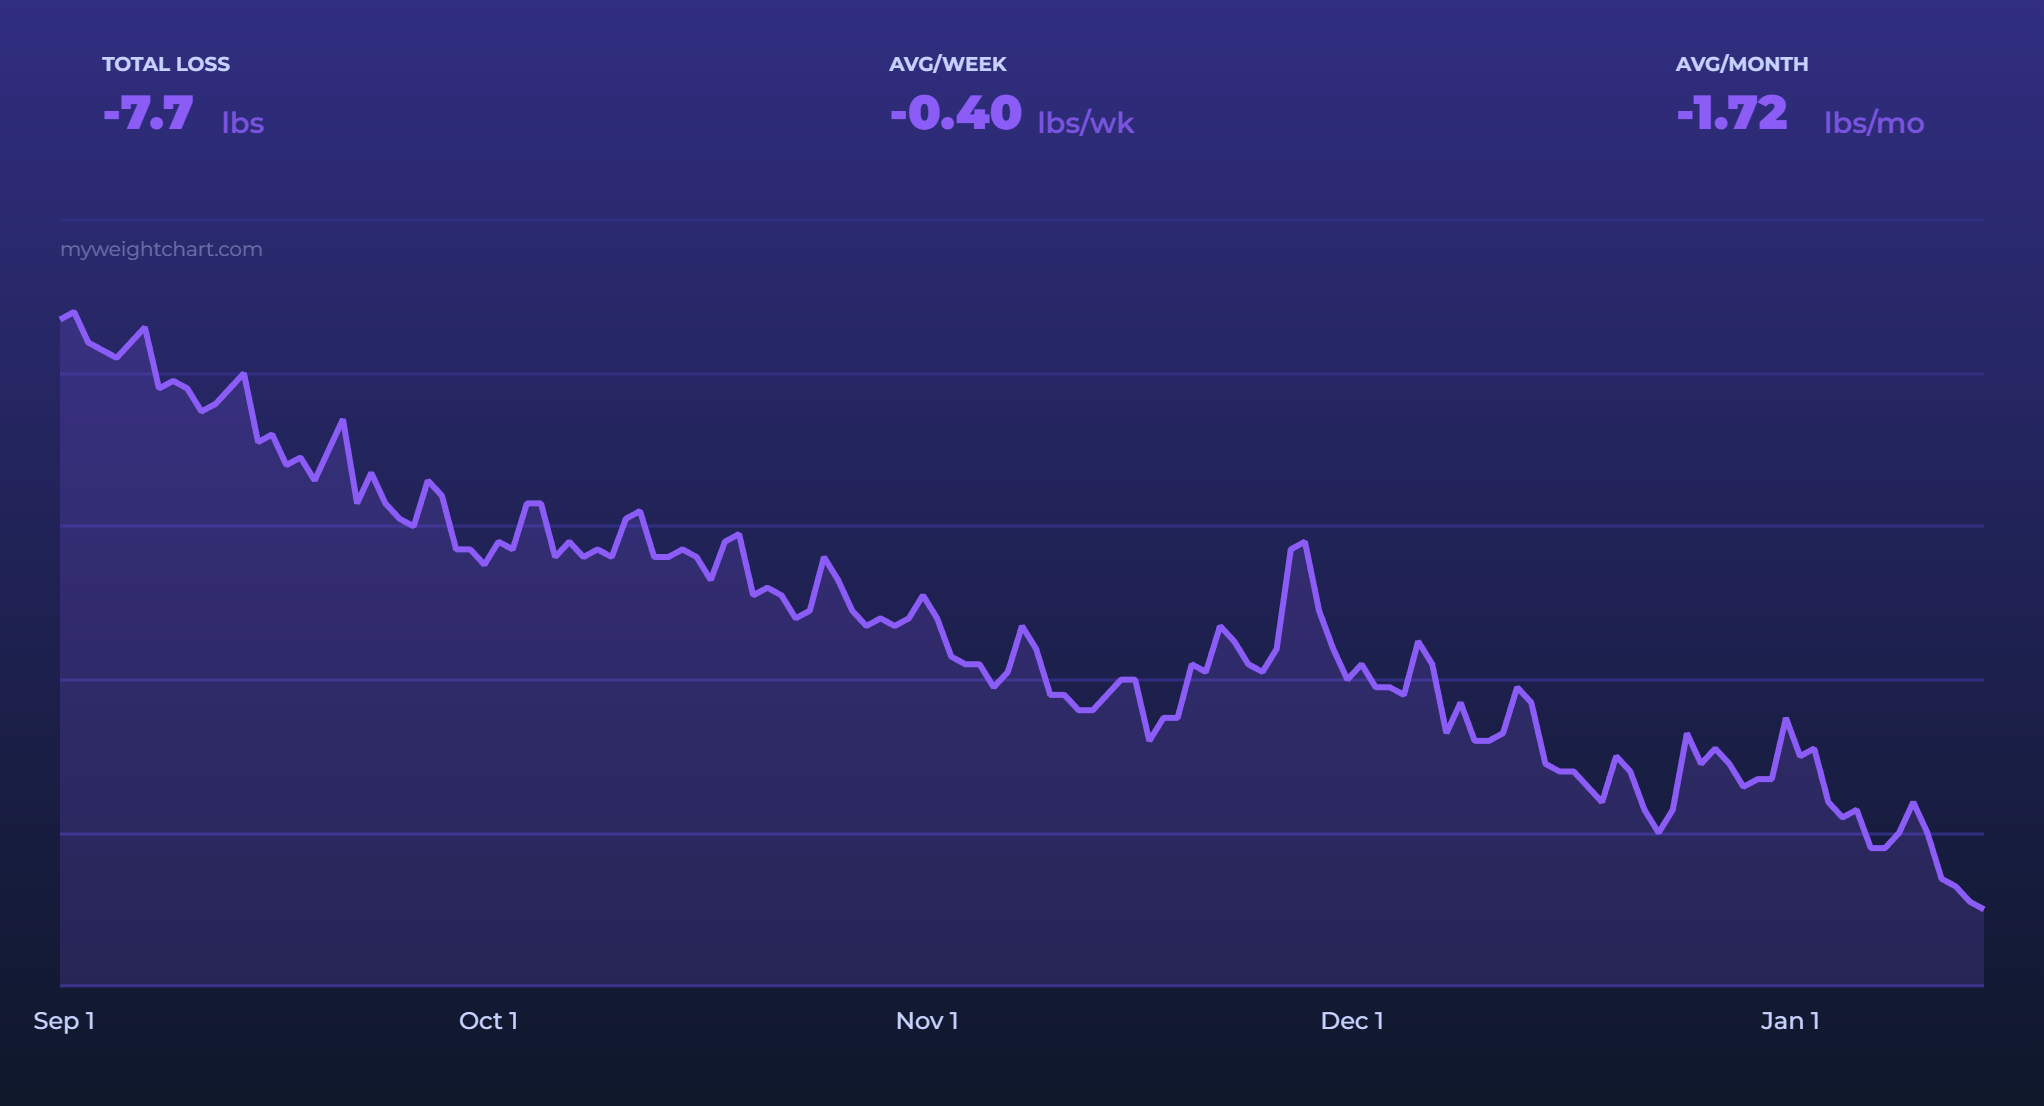
Using sample data
This chart is showing sample data. Add your own CSV file in the settings to create a personalized weight chart!
About this tool
This weight chart generator helps you create beautiful visualizations of your weight progress. Use it to plot your weight dataover time and see your journey in a clear, visual format. Whether you're tracking weight loss, weight gain, maintenance, or any other health goal, this tool transforms your data into a professional progress graph. Once you're happy with your chart, you can download your weight loss chart as a PNG to share your progress anywhere.
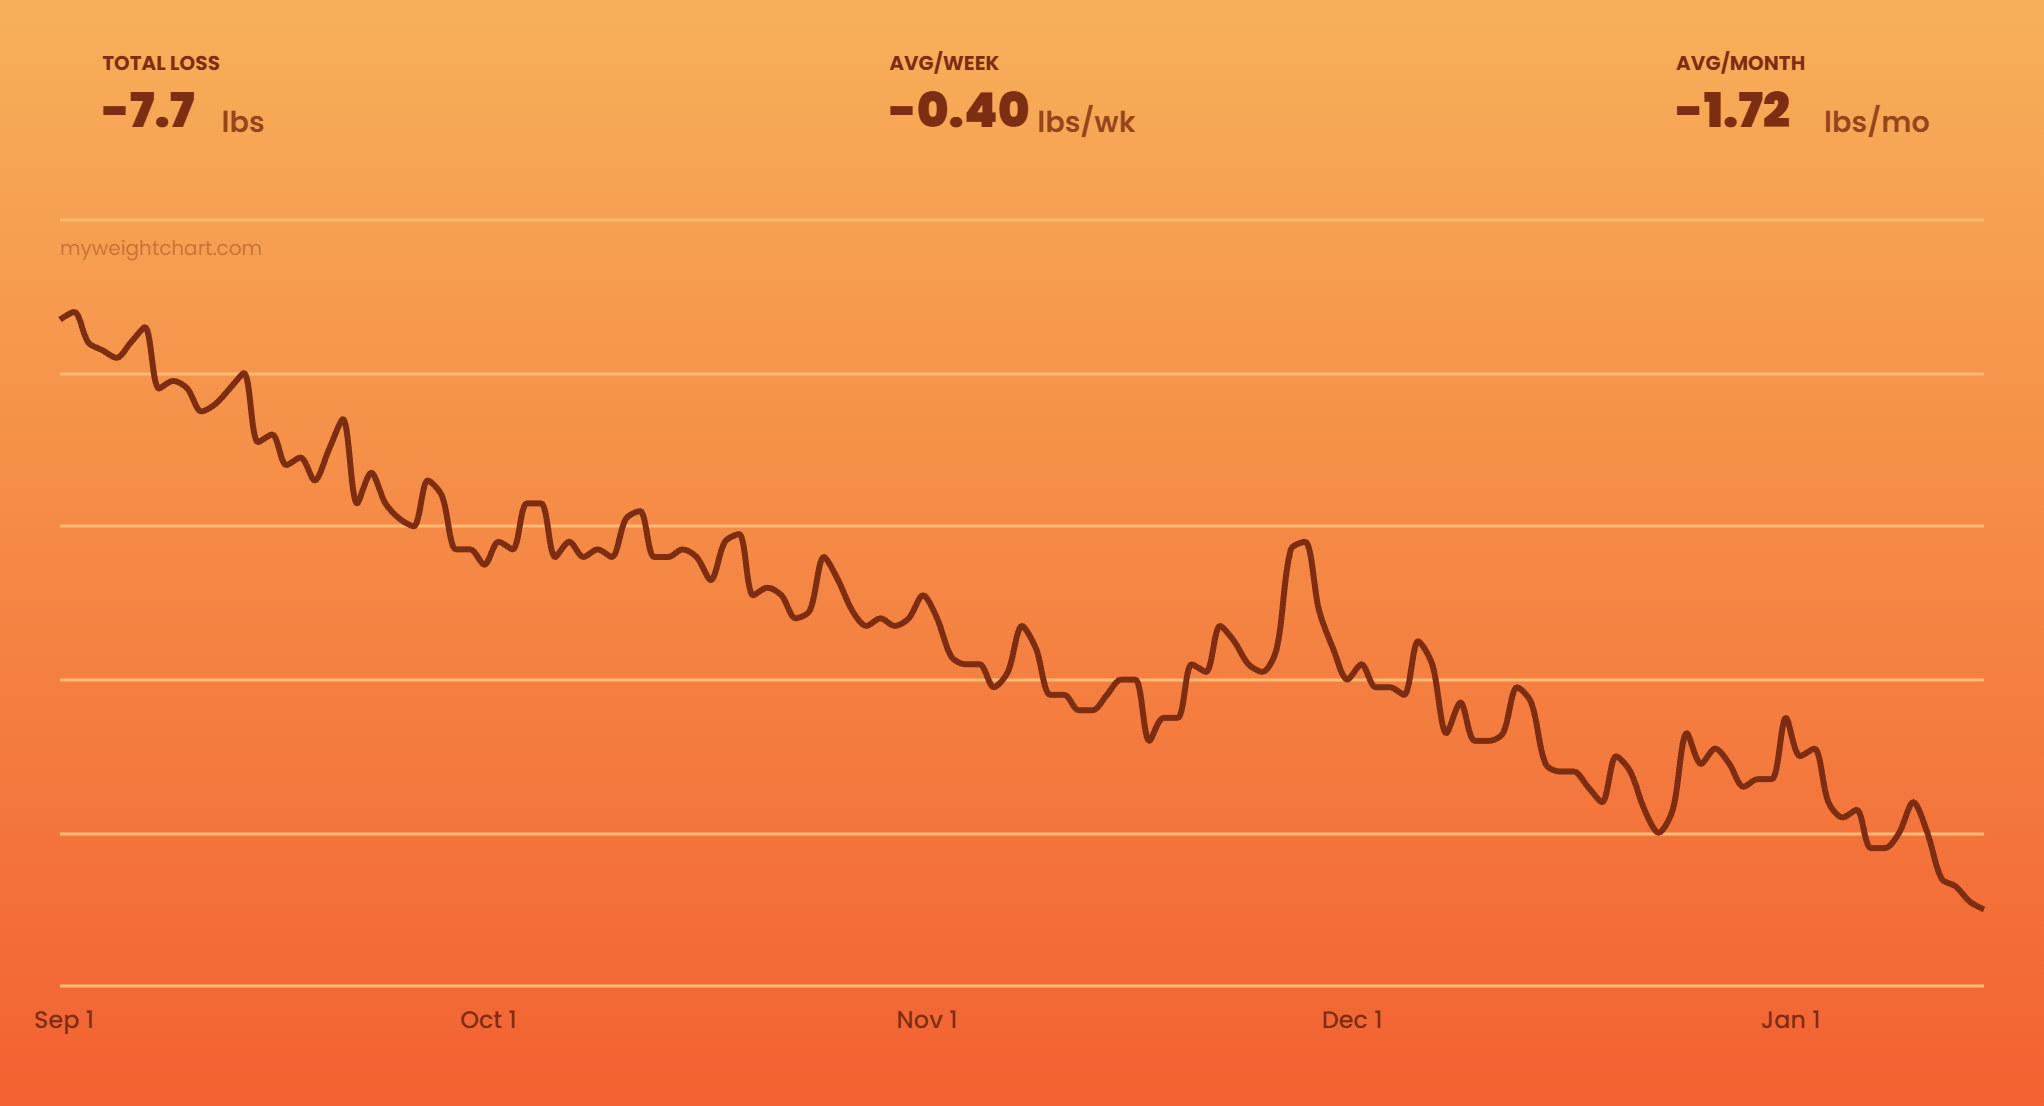
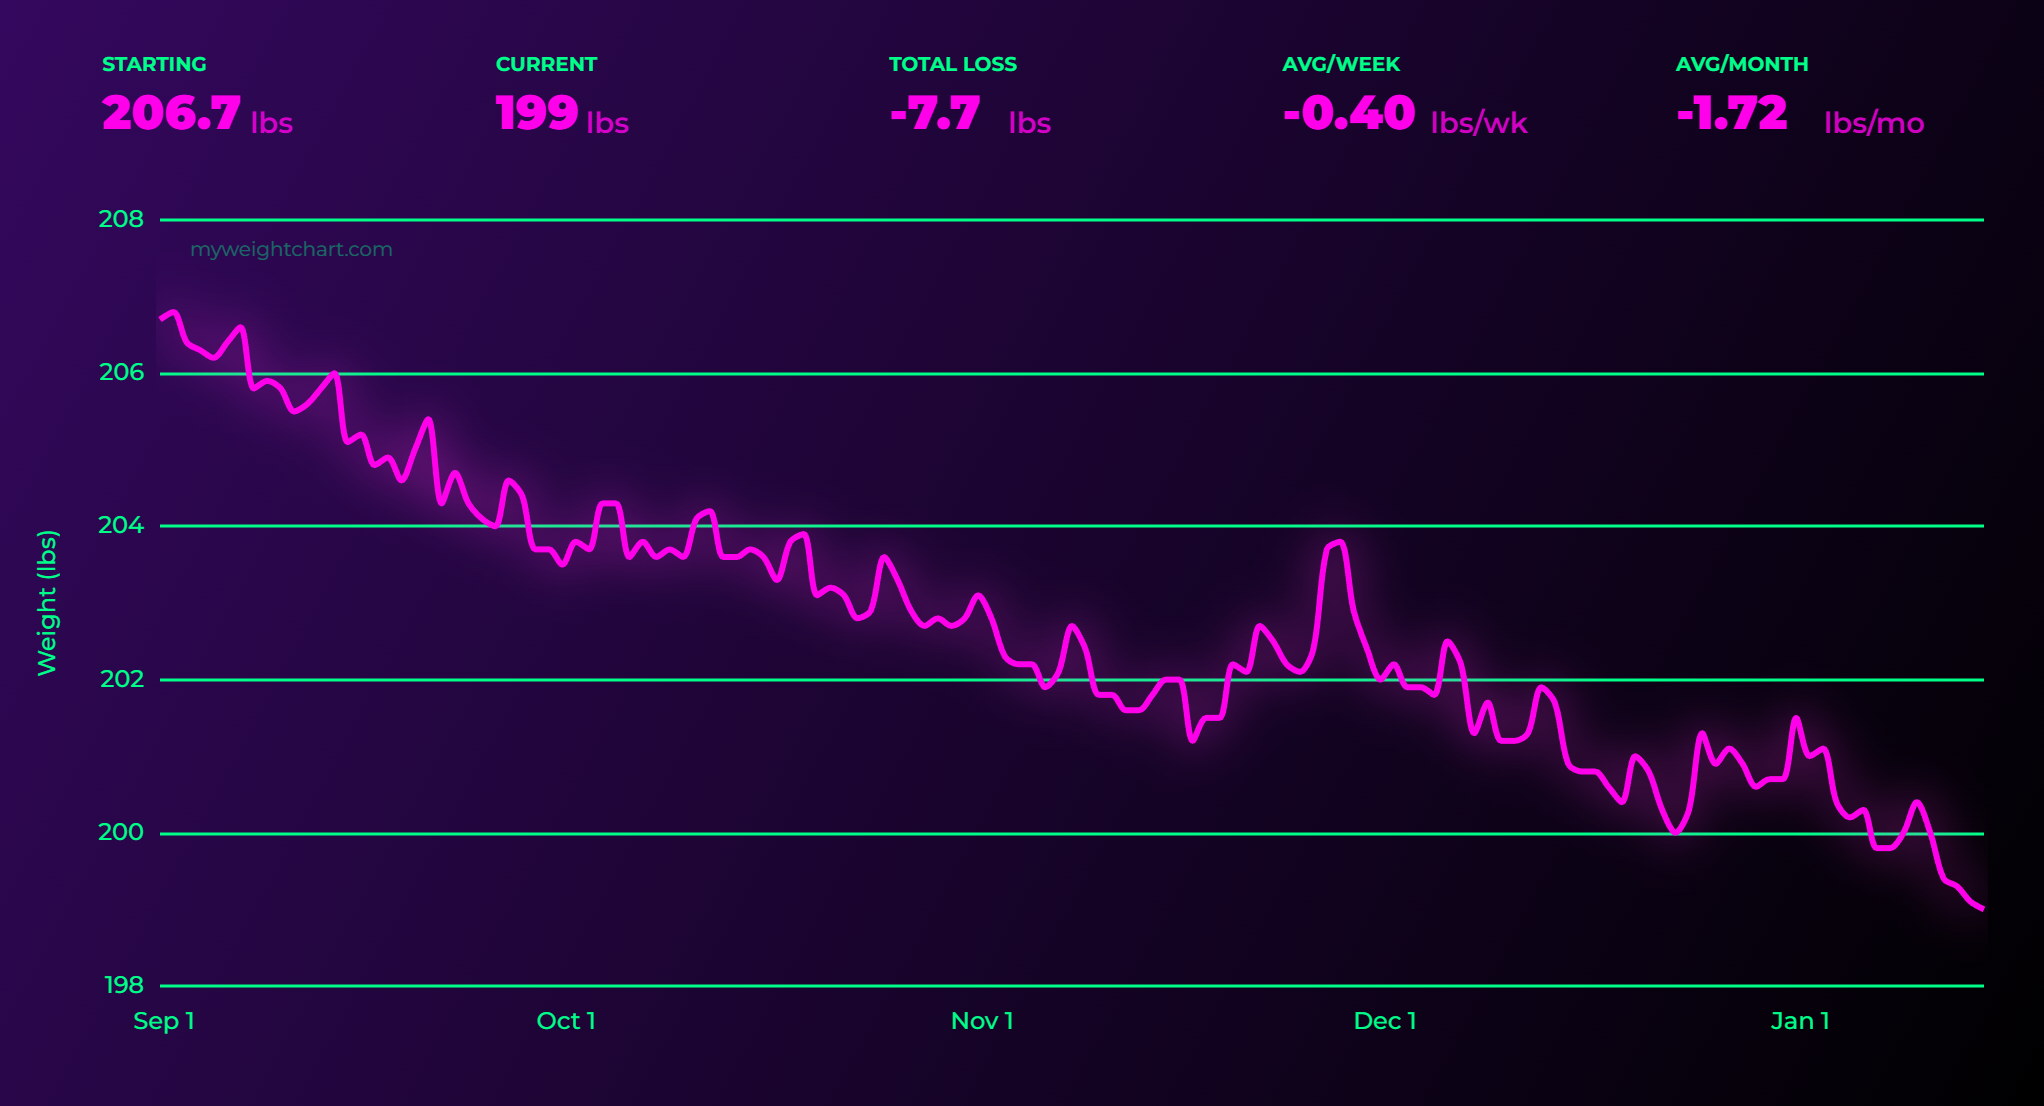
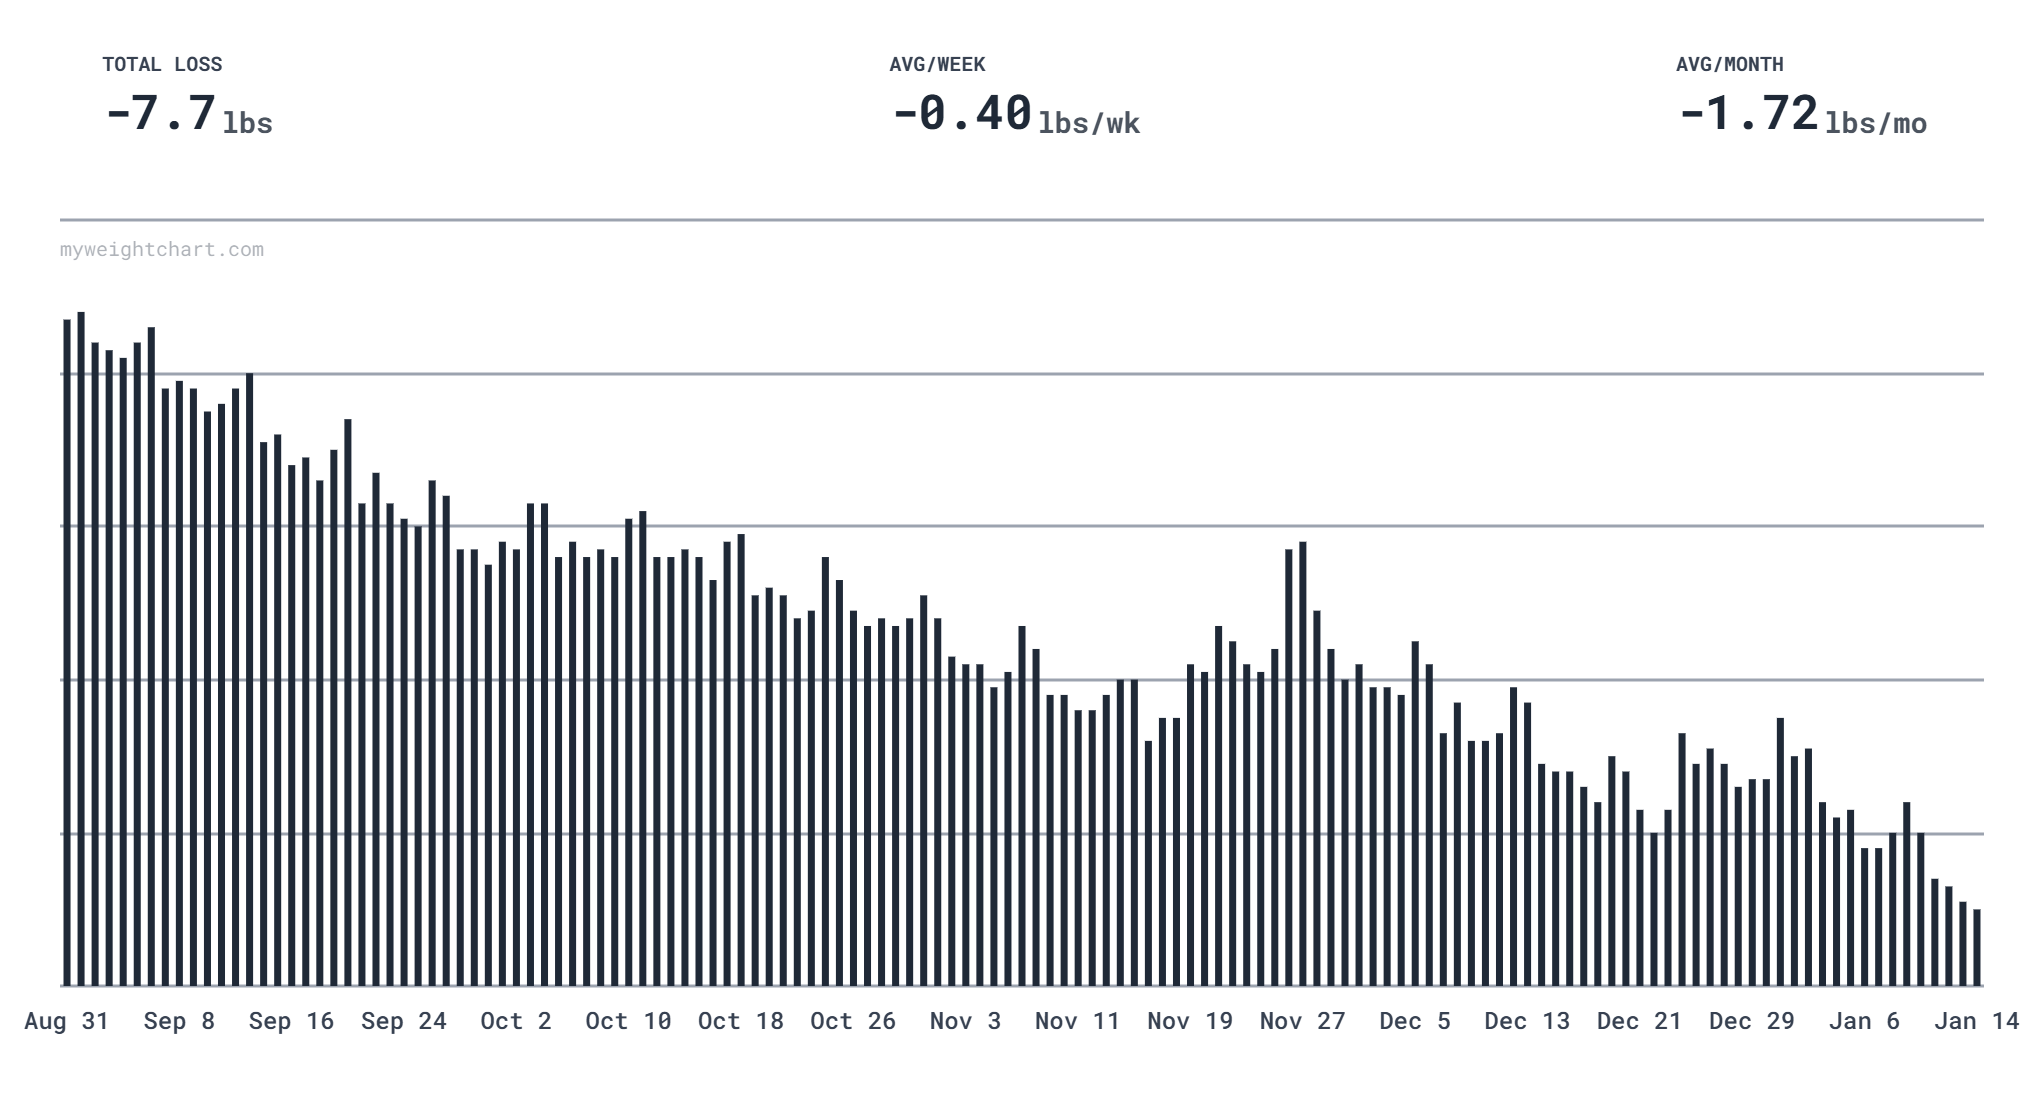
Chart examples
Explore different themes and styles or create your own.
Getting started
1. Prepare your CSV file
Create a CSV file with at least two columns: one for dates and one for weight values. Dates can be in various formats (e.g., "2026-01-15", "Jan 15, 2026", or "01/15/2026"), and weights should be numeric values.
You can also export your weight history from many weight tracking apps and smart scales like Fitbit or Apple Health — just export your data as a CSV file and upload it here.
2. Select your file
Click "Select file" in the settings sidebar and choose your CSV file. Your data stays on your device and is never uploaded to any server.
3. Select your columns
After uploading, a dialog will appear asking you to select which column contains dates and which contains weight values. Choose the appropriate columns and click "Confirm".
4. Customize your chart
Use the settings panel to customize colors, fonts, chart type, metrics, and more. All changes are saved automatically and will persist when you refresh the page.
5. Download your chart
Once you're happy with your chart, click the "Download your chart!" button to save it as a PNG image that you can share!
Features
Themes & customization
Choose from beautiful preset themes or create your own custom color scheme. Customize fonts, chart types, backgrounds, and patterns to match your style.
Key metrics
Show top metrics like starting weight, current weight, total change, and average change per week or month. Toggle metrics on or off to focus on what matters most.
Time range filtering
Focus on specific periods with preset ranges or custom date filters. Visualize different phases of your journey with ease.
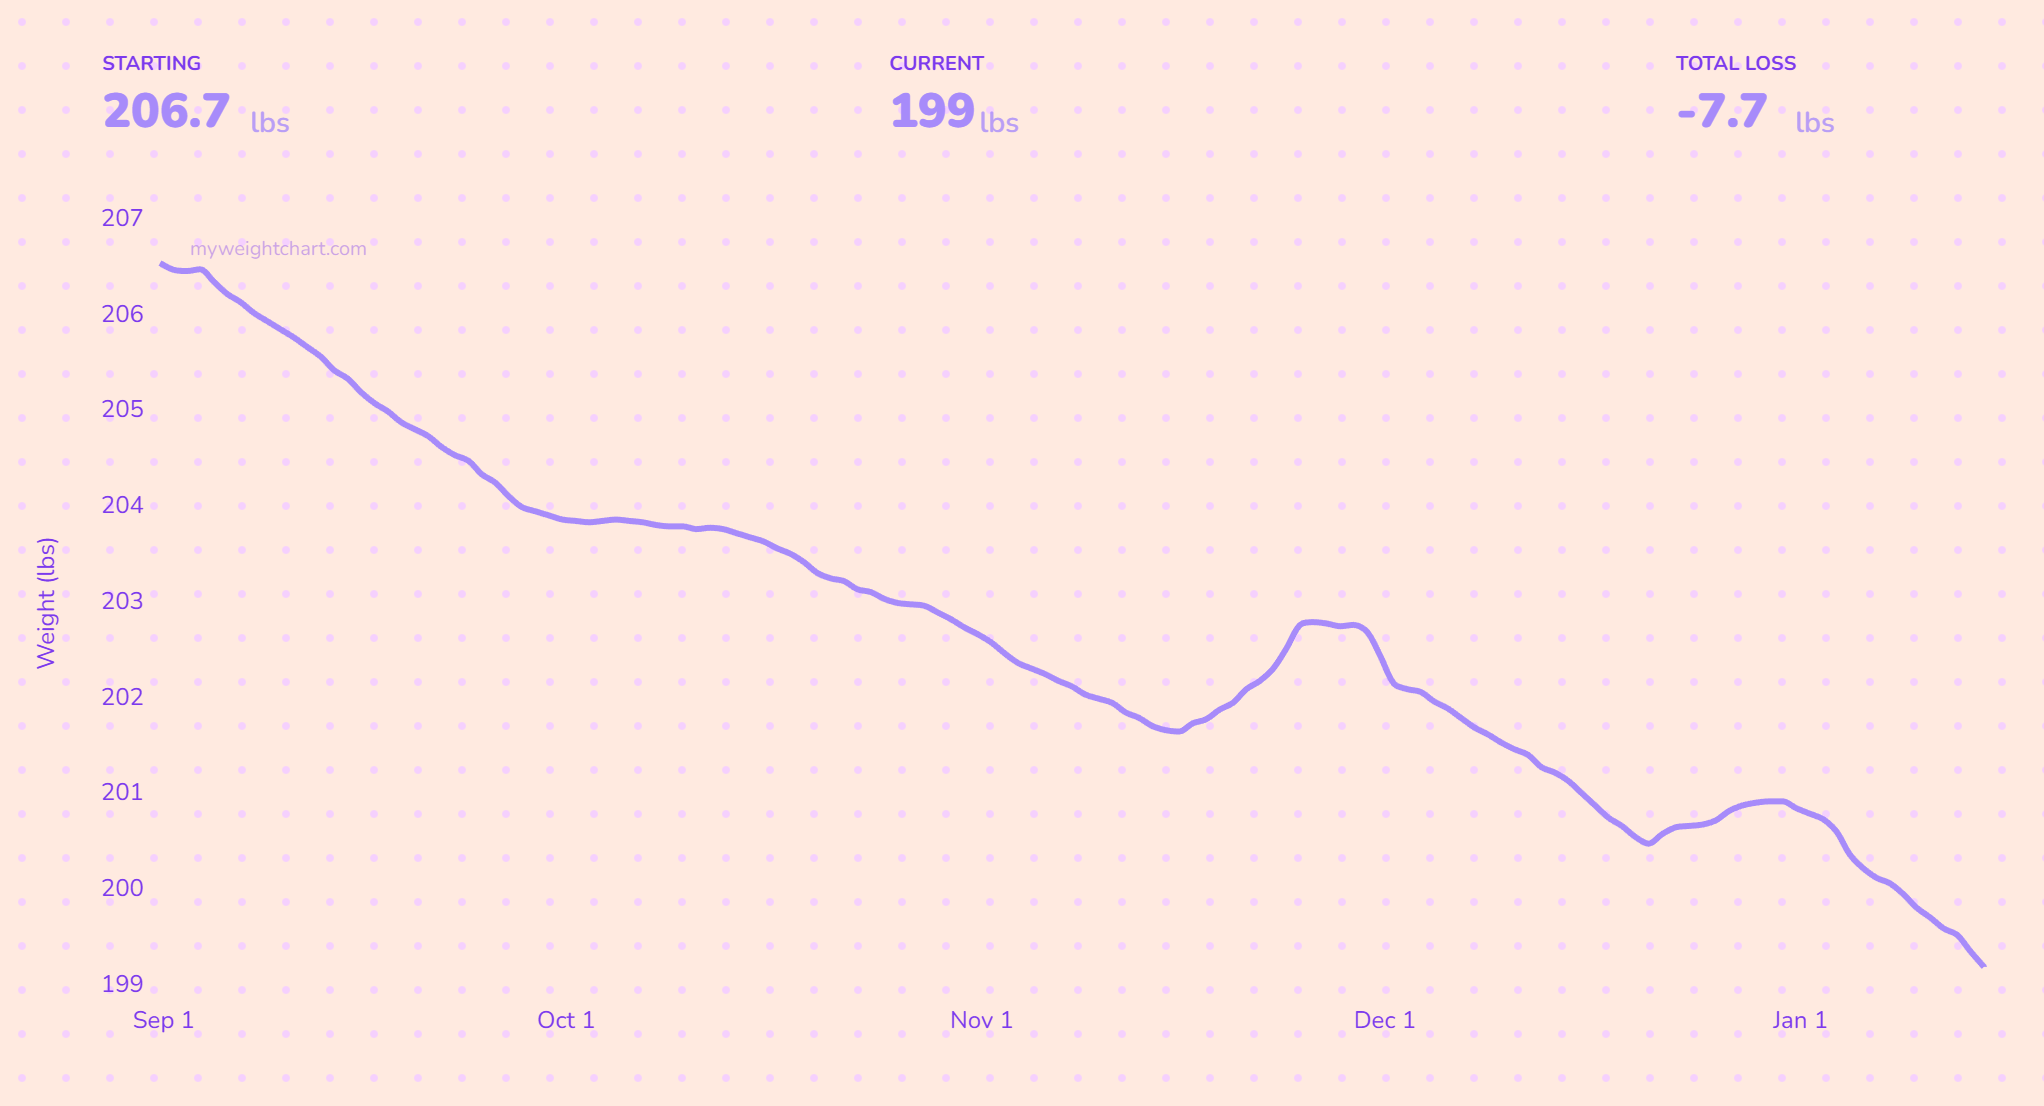
Moving averages
Smooth out daily fluctuations with moving averages to see long-term trends more clearly. Adjust the number of points to fine-tune the smoothing.
Export & share
Download your chart as a high-quality PNG image. Hide weight values for privacy when sharing, or show them for detailed progress tracking.
Privacy first
All processing happens in your browser. Your data never leaves your device — no uploads, no storage, no tracking.